

You don't see it on this graph (because I recreated the graph at home to take a picture of it), but after everyone makes their pick, we count how many people picked one category or another, and then one Little Person comes up and writes that number on that side of the graph.
The next day we graphed what kind of pet everyone had. Dogs and "no pets" definitely won on this graph, although if I had to do it again, I would have more than one card for each child, so they could put their name in more than one column if they had more than one type of pet.

I used my "graphing" pocket chart for this one. It's actually a "hundreds" chart, but it works perfectly for graphing. The only thing I would do differently next time is have the Little People write their names on the cards themselves.
Next we graphed whether their pet was an inside pet or an outside pet. When at first they had trouble with understanding what this meant, I asked whether their pet slept outside or inside. If they didn't have a pet, they got to tell me what kind of pet they might like to have some day, and whether they would want it to sleep inside or outside.
.JPG)
For this graph I used my large white board and our magnetized popsicle name sticks.
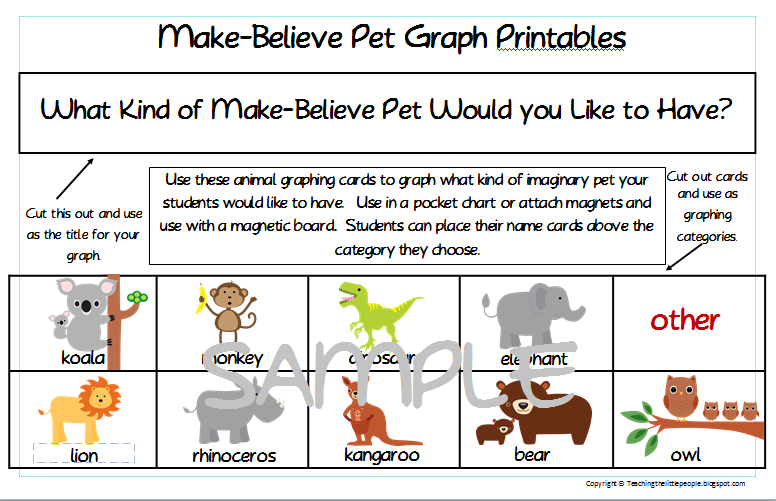
Finally, to make the playing field level for all (meaning that I gave both the pet owners and the non-pet owners equal opportunity) I asked them what kind of make-believe pet they would like to have out of the ones shown on the graph. They especially seemed to enjoy this.

I used chart paper and labels for this graph, taping the pet cards on at the bottom and the graph title at the top.
The pictures and graph titles for all of these graphs are my printables that I just in my teacher stores.
You can see them in the store here - thanks for looking!


Hi
ReplyDeleteI do teacher training workshops. I am writing to ask permission to use the photo of the pet graph on a magnetic board in a Power Point Presentation. I will credit your site and provide your URL.
Please respond to: epostman3@cox.net
I look forward to hearing from you.